0days until NEET 2026Every question counts. ✊
⚡
Did you know?
A bolt of lightning heats the surrounding air to ~30,000 K — five times hotter than the Sun's surface.
Did you know?
A bolt of lightning heats the surrounding air to ~30,000 K — five times hotter than the Sun's surface.
Which of the following graphs represents the variation of resistivity with temperature for copper?
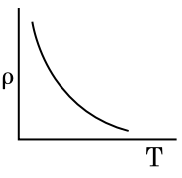
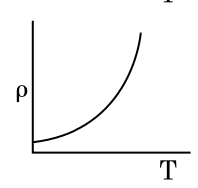
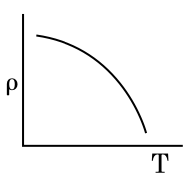
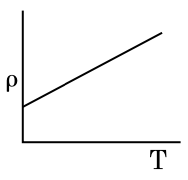
To determine which graph represents the variation of resistivity with temperature for copper, we need to understand the behavior of metals.For metals like copper, resistivity increases with temperature. This is because as temperature rises,the lattice vibrations increase, causing more collisions for the electrons and thus increasing resistivity.The relationship is approximately linear over a moderate temperature range and can be expressed as:
More practice, more score
Use hints to get start solving
Ask any question, get instant answers
Get detailed step by step solutions
Read while solving
Improve every day