0days until NEET 2026Every question counts. ✊
🌡️
Did you know?
Absolute zero (−273.15°C) is the coldest possible temperature — at which atoms nearly stop moving.
Did you know?
Absolute zero (−273.15°C) is the coldest possible temperature — at which atoms nearly stop moving.
Choose the correct option for graphical representation of Boyle’s law, which shows a graph of pressure vs. volume of a gas at different temperatures:
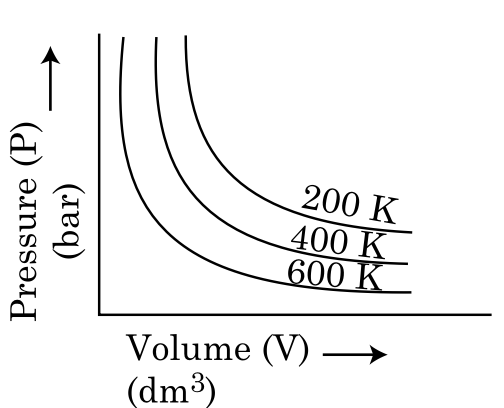
To solve this problem, we need to understand Boyle's Law, which states that for a given mass of gas at constant temperature, the pressure of the gas is inversely proportional to its volume. Mathematically, this is expressed as:constantThis implies that if we plot pressure (P) against volume (V), we should get a hyperbolic curve. The graph should show that as volume increases, pressure decreases, and vice versa.Let's analyze the options:Option 1: Shows hyperbolic curves with increasing temperature from top to bottom (200 K, 400 K, 600 K). This is consistent with Boyle's Law, as higher temperatures should have lower pressures for the same volume.
More practice, more score
Use hints to get start solving
Ask any question, get instant answers
Get detailed step by step solutions
Read while solving
Improve every day