Every question counts. ✊
🌿
Did you know?
A single strand of DNA, if uncoiled, would be ~6 feet long — yet it fits inside a cell nucleus.
Did you know?
A single strand of DNA, if uncoiled, would be ~6 feet long — yet it fits inside a cell nucleus.
The graph which shows the variation of the de Broglie wavelength of a particle and its associated momentum is?
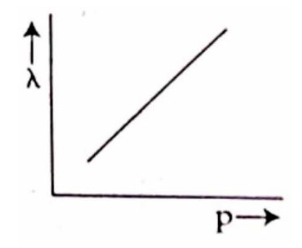
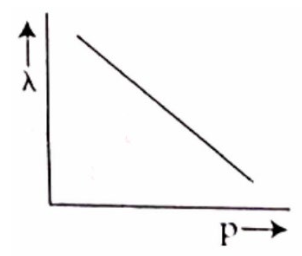
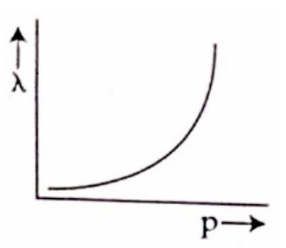
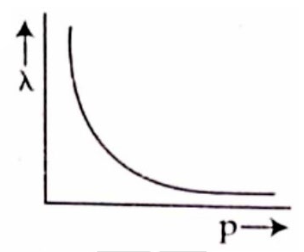
To solve this problem, we need to understand the relationship between the de Broglie wavelength and momentum The de Broglie wavelength is given by the formula:where is Planck's constant.From the formula, we can see that is inversely proportional to This means that as the momentum increases, the wavelength decreases.The graph that represents an inverse relationship is a hyperbola.Let's analyze the options:• Option 1 shows a linear increase, which is incorrect.• Option 2 shows a linear decrease, which is incorrect.• Option 3 shows an upward curve, which is incorrect.• Option 4 shows a downward curve, which represents an inverse relationship.Therefore, the correct graph is Option 4, which shows the inverse relationship between and
More practice, more score
Use hints to get start solving
Ask any question, get instant answers
Get detailed step by step solutions
Read while solving
Improve every day