Every question counts. ✊
💧
Did you know?
Water is the only substance found naturally in all three states on Earth's surface.
Did you know?
Water is the only substance found naturally in all three states on Earth's surface.
The velocity (v) - time (t) plot of the motion of a body is shown below. The acceleration (a) - time (t) graph that best suits this motion is:
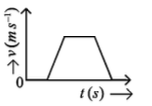
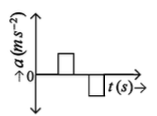
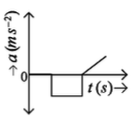
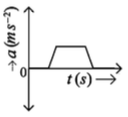
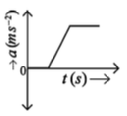
To solve this problem, we need to analyze the given velocity-time graph and determine the corresponding acceleration-time graph.The velocity-time graph is a trapezoid, indicating three phases of motion:1. Acceleration phase: The velocity increases linearly from 0 to a maximum value.2. Constant velocity phase: The velocity remains constant at the maximum value.3. Deceleration phase: The velocity decreases linearly back to 0.Let's analyze each phase:• Acceleration Phase:The slope of the velocity-time graph is positive, indicating a constant positive acceleration.• Constant Velocity Phase:The slope is zero, indicating zero acceleration.• Deceleration Phase:The slope is negative, indicating a constant negative acceleration.Now, let's match these observations with the options:Option 1:• Positive constant acceleration, zero acceleration, then negative constant acceleration.Option 2:• Zero acceleration, then negative acceleration increasing in magnitude.Option 3:• Positive acceleration, zero acceleration, then positive acceleration again.Option 4:• Increasing acceleration, then constant acceleration.The correct acceleration-time graph should show:• A positive constant value, then zero, then a negative constant value.Therefore, the correct option is Option 1.
More practice, more score
Use hints to get start solving
Ask any question, get instant answers
Get detailed step by step solutions
Read while solving
Improve every day